Research Use Only. The information presented here is for scientific and educational purposes. These compounds are not intended for human consumption, self-administration, or therapeutic use.
Introduction
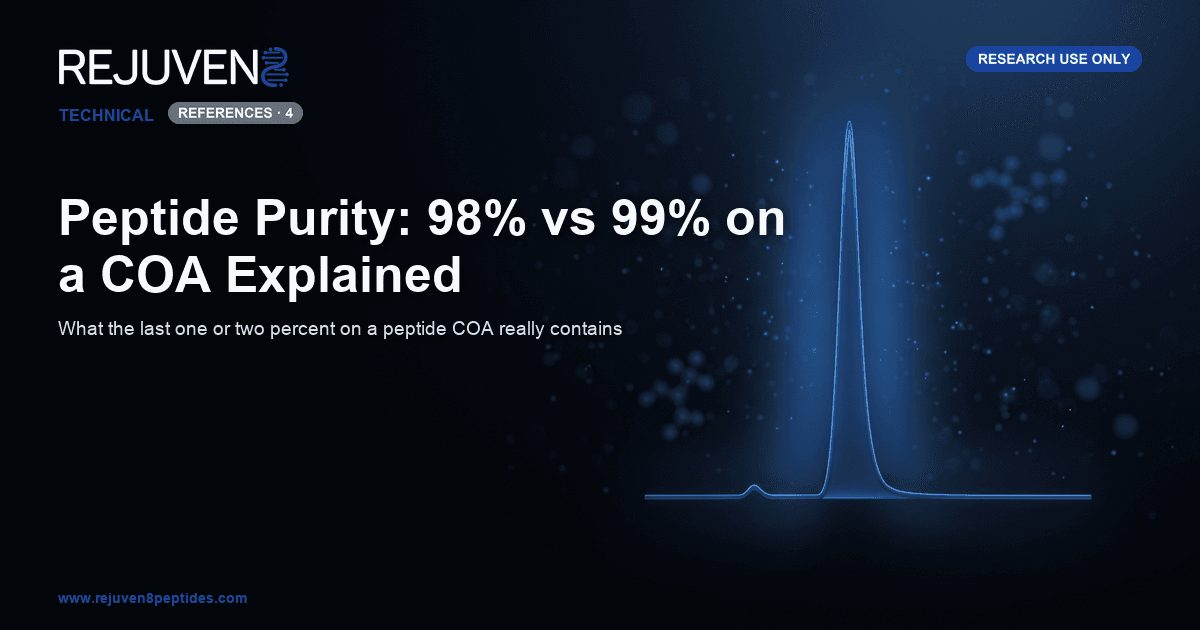
A certificate of analysis for a research peptide usually leads with one number: 98.6%, 99.2%, “greater than 99%”. That figure is peptide purity, the most quoted value on the document. It comes from reversed-phase high-performance liquid chromatography (HPLC) with ultraviolet detection and describes only the share of UV-absorbing material that left the column as the main peak. It does not say how much peptide the vial holds, whether that peak is the right molecule, or what the remaining one or two percent is.
This explainer covers what separates a 98% lot from a 99% lot, why one vial can yield two purity values in two laboratories, and how purity relates to identity, content, endotoxin, and bioburden. All material discussed is supplied for research use only, not for human consumption.
What Peptide Purity Means on a Certificate of Analysis
Area Percent at 214 or 220 nm
Dissolved peptide is loaded onto a C18 reversed-phase column and eluted with a rising acetonitrile gradient containing 0.1% trifluoroacetic acid (TFA). Species elute in order of increasing hydrophobicity and pass a UV detector set to 214 or 220 nm, where the backbone amide bond absorbs, so each peptide-like species gives a signal roughly proportional to its number of amide bonds. Purity is the main peak area divided by the summed area of all integrated peaks: area-percent purity, the definition behind nearly every figure on a peptide COA.
What the Number Leaves Out
Area-percent assumes that everything of interest absorbs at the chosen wavelength and separates from the main peak; anything else is invisible. Bound water produces no peak. Trifluoroacetate counter-ions paired with basic residues dissolve into a mobile phase that already contains TFA, and inorganic salts elute at the excluded solvent front. A lot that is 99% pure by HPLC can carry 15% or more non-peptide mass without contradiction.
98% vs 99%: What Lives in the Remaining 1 to 2 Percent
Related-Substance Impurities
The material outside the main peak is almost entirely related substances, molecules structurally close to the target that arose in the same synthesis or from its degradation. Because every coupling and deprotection step runs slightly short of completion, a lot contains:
- Deletion, insertion, and truncated sequences: a residue skipped after a failed coupling (a missing glycine is 57 Da lighter), duplicated after a double coupling, or a chain capped early.
- Residual protecting groups: a tert-butyl (about +56 Da), trityl, or Pbf group left on a side chain, eluting later because it is more hydrophobic.
- Oxidized variants: methionine sulfoxide or oxidized tryptophan, +16 Da per oxygen, usually eluting earlier.
- Deamidated variants: asparagine or glutamine converted to the acid form, about +1 Da, often eluting very close to the parent.
- Epimers and dimers, which share the target’s mass or nearly so and may partially co-elute.
Why Composition Matters More Than the Decimal
Moving from 98% to 99% removes one point of this mixture; whether that matters depends on what it was. A lot at 98.0% with a single 1.6% peak has one dominant related substance, usually one a mass spectrum can name; a lot at 98.0% with twelve peaks near 0.15% has the diffuse profile of a long sequence. The distinction lives in the integration table and the mass spectrum, as the guide to reading a peptide COA explains.
Purity, Identity, and Peptide Content Are Three Different Measurements
HPLC purity answers “how much of what eluted is the main peak,” identity by mass spectrometry answers “does the main peak have the intended mass,” and net peptide content answers “how much of the powder is peptide at all.” The entries below reflect commonly reported laboratory attributes and are provided for comparison only.
| Test | What it measures | What it does tell you | What it does not tell you |
|---|---|---|---|
| HPLC purity (UV, 214/220 nm) | Main peak area as a percentage of total integrated area | Share of related substances resolved by the stated method | Peptide mass; water, salt, or counter-ion content; identity; co-eluting isomers |
| Mass spectrometry identity (ESI or MALDI) | Observed mass or m/z versus theoretical | Whether the main species has the expected mass | Purity (ionization efficiency varies); non-ionizing contaminants |
| Net peptide content (amino acid analysis, elemental nitrogen analysis, or UV) | Fraction of gross dry weight that is peptide | Peptide versus water, counter-ions, and salts by mass | Whether that peptide is the target sequence |
| Endotoxin (LAL or recombinant factor C) | Bacterial lipopolysaccharide, in endotoxin units per mg | Whether endotoxin could confound cell assays | Chemical purity, identity, or content |
| Sterility or bioburden | Viable microorganisms present | Microbial status of the lot as tested | Chemical purity, identity, endotoxin, or content |
A Worked Example: 10 mg at 98% Purity and 85% Net Peptide Content
Consider a vial with a 10 mg gross fill weight, 98% HPLC purity, and 85% net peptide content. Content applies first: 10 mg x 0.85 = 8.5 mg of peptidic material; the other 1.5 mg is water, trifluoroacetate, and salts. Purity then applies to that fraction: 8.5 mg x 0.98 = 8.33 mg, approximately 8.3 mg of the target peptide. At 99% purity the target mass would be 8.42 mg, a difference of 85 micrograms; at 80% content and 98% purity it would be 7.84 mg, a difference of about half a milligram. Content moves the quantity of peptide far more than a one-point change in purity.
Why Two Labs Can Report Different Purities for the Same Lot
Purity is a method-dependent value, not a property of the powder. Two laboratories analyzing one lot can report 98.2% and 99.1% while both following valid procedures.
Detection Wavelength
At 214 nm every amide bond contributes signal. At 280 nm only tryptophan and tyrosine absorb appreciably, so impurities lacking those residues vanish and the purity figure rises, while aromatic protecting-group adducts absorb strongly at 254 to 280 nm and appear larger than their mass fraction. A certificate that names its wavelength can be interpreted; one that omits it cannot.
Gradient, Column, and Integration
A shallow gradient over 30 to 60 minutes can separate a single-residue deletion or a deamidated variant from the main peak; a steep 10-minute gradient may fold the same species into a shoulder integrated as target. Column chemistry (C18 versus C8 or C4), particle size, pore size, temperature, and TFA versus formic acid all change resolution. Integration settings (peak threshold, blank subtraction, baseline placement under a shoulder) add further variation. Samples also change between analyses through oxidation and deamidation, as covered in the peptide storage and handling overview.
Reading a Peptide COA and Its Chromatogram
What a Well-Documented Certificate Shows
A peptide COA that supports its headline number includes the peptide name, sequence, and theoretical mass; a lot number matching the vial label; the date of analysis; a method summary naming the column, gradient, and wavelength; the chromatogram with an integration table of retention time, area, and area percent; and the mass spectrum with observed and calculated mass. Rejuven8 publishes lot-specific documents on its certificates of analysis page, and the research peptide supplier vetting guide covers how to weigh such documentation.
Main Peak, Shoulders, and Minor Peaks
On the chromatogram, the main peak is the tallest feature, and its retention time should be consistent across lots run on the same method. A shoulder on its leading or trailing edge signals a partly resolved related substance; if the software has not split it off, the reported purity overstates the true value. Pre-peaks are typically more hydrophilic species such as oxidized or deamidated variants; post-peaks are typically more hydrophobic, such as residual protecting groups and dimers.
Read this way, peptide purity becomes a defined measurement rather than a marketing figure: an area-percent value tied to a wavelength, a column, and a gradient. A 98% lot with a documented chromatogram, matching mass spectrum, and stated peptide content is better characterized than a 99% figure with no supporting data. Researchers comparing lab-tested research peptides should read the whole certificate, not its first line.
Frequently Asked Questions
Is 99% peptide purity meaningfully better than 98%?
Not automatically. The one-point difference is a small change in the share of related substances. A 98% lot with one identified deletion sequence can be better characterized than a 99% lot with several unidentified peaks.
What does purity on a peptide COA actually measure?
The area of the main HPLC peak divided by the total area of all integrated peaks, usually detected by UV absorbance at 214 or 220 nm. It does not measure water, counter-ions, salts, or absolute peptide mass.
What is the difference between peptide purity and net peptide content?
Purity describes the peptidic fraction: how much of it is the target sequence rather than related substances. Net peptide content describes the whole powder: how much of the gross weight is peptide rather than water, counter-ions, and salts.
Why do two labs report different peptide purity for the same lot?
Because purity is method-dependent. Detection wavelength, gradient slope, column chemistry, ion-pairing agent, integration thresholds, and sample age all change the number. Readings of 98.2% and 99.1% for one lot can both be valid under different methods.
Does mass spectrometry tell you peptide purity?
No. Mass spectrometry confirms identity by comparing the observed mass with the calculated mass of the intended sequence. Because species ionize with different efficiency, spectrum intensity is not a reliable measure of amount, so purity is assigned by HPLC with UV detection.
References and Further Reading
- D’Hondt M and colleagues at Ghent University (2014) reviewed related impurities in synthetic peptides, including deletion, insertion, protecting-group, oxidation, deamidation, and racemization products. PubMed: related impurities synthetic peptides
- LC-HRMS methods for identifying and quantifying structurally related peptide impurities, including method validation studies published in 2025 and 2026. PubMed: structurally related peptide impurities LC-HRMS
- Amino acid analysis and elemental analysis for assigning peptide content independent of chromatographic purity. PubMed: amino acid analysis peptide content quantification
- Purity assignment for synthetic peptide reference standards by mass balance and orthogonal methods such as quantitative NMR. PubMed: synthetic peptide reference standard purity assessment