Research Use Only. The information presented here is for scientific and educational purposes. These compounds are not intended for human consumption, self-administration, or therapeutic use.
Introduction
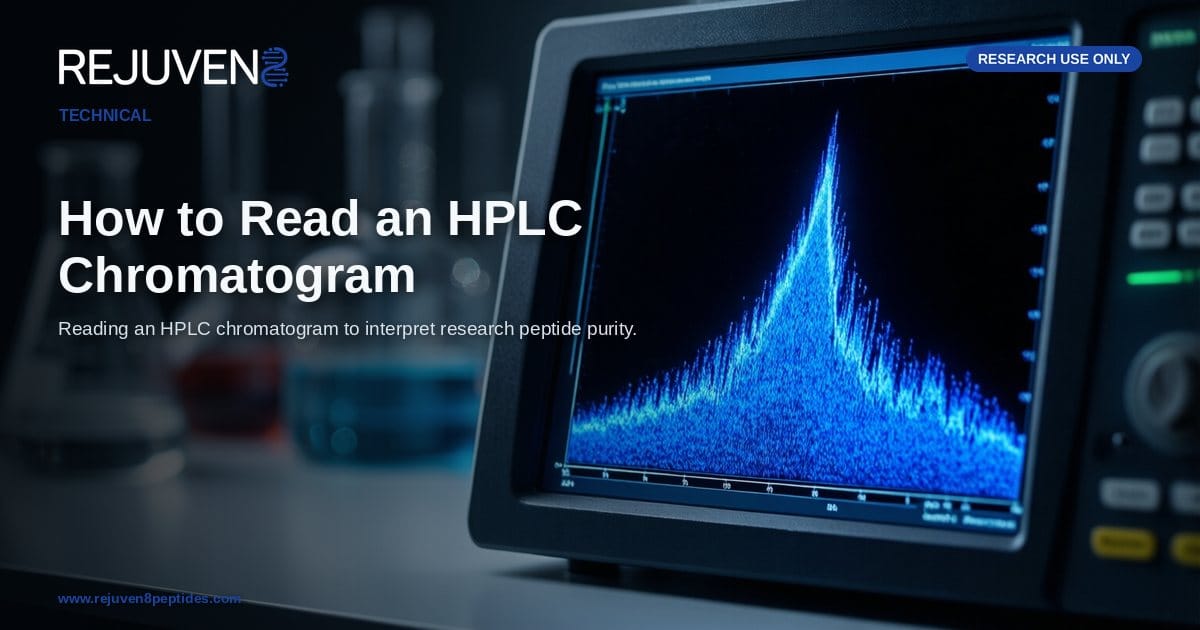
High-performance liquid chromatography (HPLC) is one of the most widely used analytical techniques for characterizing research peptides. When a laboratory reports the purity of a synthetic peptide, that figure almost always comes from a reversed-phase HPLC run, in which the sample is separated on a C18 column and monitored by an ultraviolet detector. The resulting plot, called a chromatogram, is the primary visual record used to judge how much of a sample is the target molecule and how much is something else. Learning to read this plot is a core skill for anyone evaluating a certificate of analysis.
The pathway being probed here is physicochemical rather than biological: peptides are separated according to their hydrophobicity as a solvent gradient carries them through the column at different rates. Each compound that elutes produces a peak, and the position and size of those peaks encode identity and abundance information. This article explains how to interpret retention time, the main peak, impurity peaks, and area percent, so that a chromatogram on a supplier document becomes readable rather than decorative. All material here is provided for research use only, not for human consumption.
The Anatomy of an HPLC Chromatogram
Before interpreting any single peak, it helps to understand the two axes and the baseline that every chromatogram shares.
Reading the Axes
The horizontal x-axis represents time, measured in minutes from the moment the sample is injected. The vertical y-axis represents detector response, usually ultraviolet absorbance expressed in milli-absorbance units (mAU). For peptides, detection is commonly performed at 214 nm, a wavelength where the peptide bond itself absorbs strongly, which makes the method sensitive to nearly all peptide species regardless of their side chains. A flat, low, stable trace across the run is the baseline: the signal recorded when only mobile phase, and no analyte, is passing the detector.
Peaks, Height, and Area
Each time a compound elutes from the column and passes the detector, absorbance rises and falls, tracing a peak. Two properties of a peak matter most. Peak height is the vertical distance from baseline to apex, while peak area is the integrated region between the curve and the baseline. Area is the quantity used for purity calculations, because it accounts for both how tall and how broad a peak is. Sharp, symmetrical, well-separated peaks indicate a clean separation, while broad, tailing, or overlapping peaks make integration less certain and can inflate or hide an impurity.
Retention Time and the Main Peak
What Retention Time Represents
The retention time of a peak is the elapsed time between injection and the peak apex. It reflects how strongly a given molecule interacts with the column relative to the mobile phase: more hydrophobic peptides are held longer and elute later, while more polar species leave earlier. Retention time is characteristic of a compound under a fixed method (the same column, gradient, flow rate, and temperature), which is why it is often used as a first, provisional check of identity. It is not absolute proof of identity, however, because unrelated molecules can happen to co-elute at similar times.
Locating the Main Peak
On a chromatogram of a reasonably pure peptide, one peak dominates the plot: this is the main peak, corresponding to the target compound. It is normally the tallest and largest-area feature, and its retention time should match the value stated on the certificate of analysis and, ideally, an authentic reference standard. Everything else on the trace, other than the baseline and any injection or solvent front near the very start of the run, is treated as an impurity until shown otherwise.
Impurity Peaks and Area Percent
How Purity Is Calculated
HPLC purity is reported as an area percent: the area of the main peak divided by the summed area of all integrated peaks, multiplied by 100. A value of 98 percent area means the target peak accounts for 98 percent of the total absorbance signal, with the remaining 2 percent distributed among impurity peaks. Because the calculation is based on UV absorbance rather than on mass directly, it is a relative measure, but for closely related peptide species it is a robust and widely accepted proxy for sample quality. The worked example below shows how a set of peaks translates into a purity figure. These values reflect commonly reported laboratory attributes and are provided for comparison only.
| Peak | Retention Time (min) | Area % | Typical Interpretation |
|---|---|---|---|
| Main peak | 14.2 | 98.4 | Target peptide |
| Impurity A | 12.8 | 0.9 | Early-eluting, more polar related species |
| Impurity B | 15.6 | 0.5 | Late-eluting, more hydrophobic related species |
| Impurity C | 16.9 | 0.2 | Minor hydrophobic impurity |
In this example the four peak areas sum to 100 percent, and the main peak accounts for 98.4 percent, so the sample would be described as 98.4 percent pure by HPLC.
Where Impurities Come From
Most impurity peaks on a synthetic peptide chromatogram trace back to the manufacturing process. Solid-phase peptide synthesis can leave deletion sequences (missing one residue), truncated sequences (chains that stopped early), and products of incomplete removal of protecting groups. Storage and handling can introduce oxidation (notably at methionine residues) or dimers formed through disulfide chemistry. Because many of these byproducts differ from the target by only a small change in hydrophobicity, they often appear as peaks close to the main peak, sometimes as a shoulder that is only partially resolved from it. Peaks sitting on the tail of the main peak deserve particular attention, since poor resolution there is where reported purity is most easily overstated.
Purity in Context: HPLC Alongside Other Methods
A chromatogram answers the question of how much of the sample is the main component, but it does not, on its own, prove what that component actually is. Two different peptides can share a retention time under a given method, and a UV detector cannot distinguish them. For that reason, HPLC purity is most meaningful when it is read together with an orthogonal identity method.
HPLC and Mass Spectrometry Together
Mass spectrometry (MS) measures the molecular weight of the eluting species, which confirms that the main peak has the mass expected for the intended sequence. A complete quality record therefore pairs an HPLC trace (how much) with a mass spectrum (what it is). The table below summarizes the common roles of each analytical method. These values reflect commonly reported laboratory attributes and are provided for comparison only.
| Method | What It Measures | Role in Peptide QC |
|---|---|---|
| RP-HPLC (UV) | Relative purity by area percent | Quantifies main peak versus impurities |
| LC-MS / ESI-MS | Molecular weight, identity | Confirms the observed mass matches the intended sequence |
| MALDI-TOF MS | Molecular weight | Rapid mass confirmation of the main component |
| Amino acid analysis | Residue composition | Verifies expected amino acid ratios |
Cross-Checking a Certificate of Analysis
When reviewing a supplier document, the chromatogram, the stated area percent, and the mass spectrum should all agree with one another and with the product identity. A headline purity number without an accompanying trace is difficult to verify. For a fuller walkthrough of the surrounding paperwork, see the guide on how to read a peptide COA, and for evaluating the laboratory behind the data, the notes on choosing a research peptide supplier. Published certificates of analysis let researchers compare real chromatograms against the principles described here before selecting compounds from the research peptide catalog.
Frequently Asked Questions
What does an HPLC chromatogram show for a peptide?
An HPLC chromatogram plots detector response, usually UV absorbance, against time. Each peak represents a compound that eluted from the column at a particular retention time, and the size of each peak reflects how much of that compound is present. For a peptide sample, the plot shows the target compound as a dominant main peak, with any impurities appearing as smaller peaks.
How is peptide purity calculated from an HPLC chromatogram?
Purity is reported as area percent: the integrated area of the main peak divided by the total area of all integrated peaks, multiplied by 100. If the main peak accounts for 98 percent of the total peak area, the sample is described as 98 percent pure by HPLC. The measure is based on UV absorbance, so it is a relative figure rather than an absolute mass fraction.
What is a good HPLC purity percentage for a research peptide?
Many research peptide suppliers report HPLC purities in the range of 95 to 99 percent area, with 98 percent or higher commonly regarded as high quality for synthetic peptides. The appropriate threshold depends on the intended laboratory application. Reviewing the full certificate of analysis, rather than the headline number alone, gives better context.
What is retention time in HPLC?
Retention time is the interval between sample injection and the apex of a peak. It reflects how strongly a molecule interacts with the column under a fixed method, so more hydrophobic peptides elute later. Retention time helps provisionally identify a compound, but because unrelated molecules can co-elute, it is not proof of identity on its own.
Why does my peptide HPLC chromatogram have more than one peak?
Additional peaks usually represent impurities from synthesis or storage, such as deletion sequences, truncated chains, oxidation products, or dimers. A small solvent or injection front near the very start of the run is also common. Peaks close to the main peak often correspond to related species that differ only slightly in hydrophobicity.
What is the difference between HPLC and mass spectrometry for peptides?
HPLC measures relative purity by separating components and comparing peak areas, answering how much of the sample is the main component. Mass spectrometry measures molecular weight, confirming what that component is. The two are complementary: HPLC quantifies purity while mass spectrometry verifies identity, and a thorough certificate of analysis typically includes both.